Sometimes, traders try to do many different things. Trade intraday, swing trade, short parabolic moves, buy break outs. Most of the time, its too much.
If you can find one or a few things that fit your personality and that give you an edge and you hone like crazy, practice and get better, you will find success.
So its no surprise that many of the best traders I know do a small number of things exceptionally well.
A couple years back, we wrote a book on the topic called The StockTwits Edge and it has tons of go to and in depth setups from some of the best of the StockTwits community.
More recently, I asked a few pros to share their bread and butter trades and here’s their responses…
@upsidetrader – One of my all time faves is buying the 200 period moving average on the daily or the 10 minute chart. It’s also a great place to get short for a trade on the pother side on those same two time frames when the moving average acts as resistance.
@Ivanhoff – One of my favorite setups involves scanning for relative strength on weak market days. Here are the specific characteristics I look for:
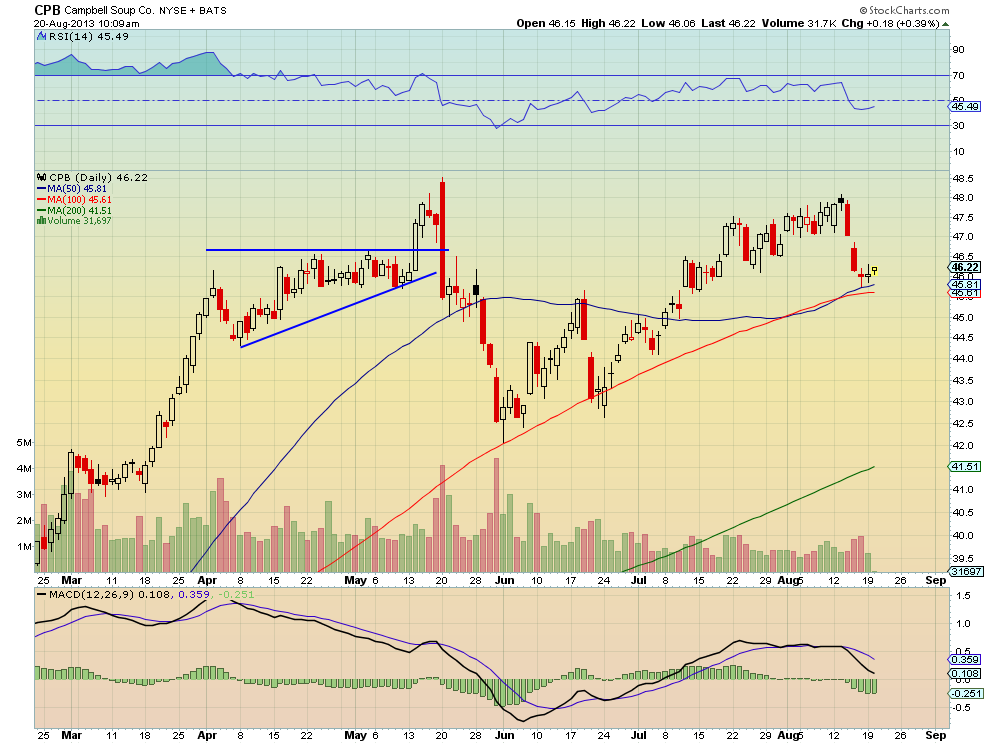
@HarmonGreg – Contrary to what many may think, from the short term trades I post on StockTwits, one of my favorite trades is focused on the oversold bounce on a long term position. One that I adjusted this week was in Campbell’s Soup, $CPB. It has a strong uptrend and a good dividend which makes it an attractive long term position. Despite the good dividend yield it also occasionally offers the opportunity to add income. As it gets extended from the Simple Moving Averages (SMA) it generally pulls back and finds support. That is when the trade adjustment kicks in.
The 1×2 Call Spread
Last week Campbell’s Soup pulled back hard to the 50 and 100 day SMA. When this happens with a stock I like to look for an opportunity to add a 1×2 Call Spread. This is like buying a Call Spread for the rebound and also selling a Covered Call. What makes this trade one of my favorites is that it can often be put on for free or a small credit. For this stock I was able to buy a September 47/48 1×2 Call Spread, buying one September 47 Call and selling 2 September 48 Calls for a net credit of 3 cents. If the stock rises above 48 by September Expiry I will get called away but also collect $1 for the Call Spread along side the Covered Call. Anywhere between 47 and 48 I sell the Call Spread for what I can get and let the Covered Call expire. Below 47 at expiry everything expires and i still own the stock. For a long term position this is a win only trade!
@reddogt3live – The 80-20 Red Dog Reversal
@kimblecharting – My strategy is called TB&M which stands for “Tops, Bottoms and NO Middles” I strive to find key turning points (at support or resistance) when sentiment is at extremes.
@kiddynamiteblog -THE KNIFECATCHER! (Editor’s note: Kids, do not try this at home. :))
@RyanDetrick – “Looking for trades that move higher (or lower), amid negative (or positive) sentiment. This shows there is still potential buying (or selling) pressure. If there’s been significant put buying on an outperformer and it pulls back to an area of technical support AND big put open interest, that is a low risk/high reward entry.”
@allstarcharts – My Bread and Butter trade?
It starts with sentiment leaning in one direction. It’s the potential unwind of that sentiment that gets me to look a little closer. So in a downtrend, for example, the extreme bearishness would first catch my attention. New lows are put in to extend the downtrend, while momentum (I use RSI) puts in a higher low. This divergence between price and momentum is bullish and sets up the risk/reward opportunity that I’m looking for. You can make the same argument and trade with extreme bullishness in sentiment while a security is in an overextended uptrend that is not confirmed by momentum. In that case, I would look to short it.
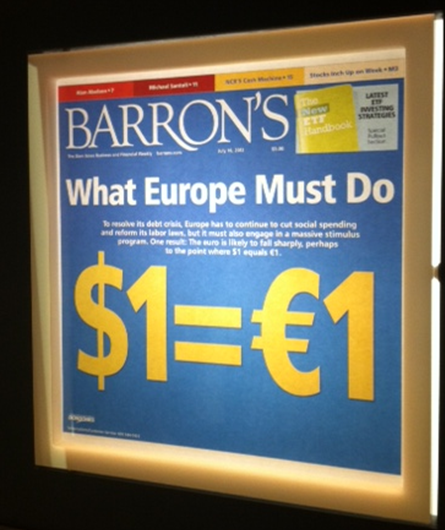
The Euro and European stocks in summer of 2012 are a great example. Remember last summer when Greece was no longer going to exist and the Euro was being called, “an experimental currency”? Attached is the bearish cover of Barrons July 16, 2013 representing the sentiment at the time. Momentum was putting in higher lows as prices of the EUR/USD and Euro Stoxx 50 were making lower lows into July.
Well European stocks bottomed out the week after the Barrons cover to rally over 40% in the next 6 months and the EURUSD also bottomed that same week and ralled 14% over the same time period.
This is my favorite trade setup. And I was writing about it as it took place. See here and here.
@alphatrends – After a stock in an uptrend has pulled back for 3-5 days I look to the intraday chart (usually 10 days 10 minutes) and watch for the short term pattern of lower highs and lower lows to be replaced by sideways price action. As the stock becomes neutral on short term, the 5DMA begins to flatten out and I then look for a short term higher high (again identified on 10 minute timeframe) and then purchase at that level.
@RiskReversal – An options trade that I like to employ when I can identify a catalyst for an individual stock is a calendar spread. Recently in FB my thought was that $38 IPO price would offer fairly significant short term resistance after the stock’s 45% rise following better than expected Q2 results. I am also of the belief that if the company is able to report better than expected results when they report Q3 earnings in mid to late Oct that the stock has another leg higher, possibly to the highs made on its iPO day back in May 2012.
$DTO $CPB $FB
Leave a Reply