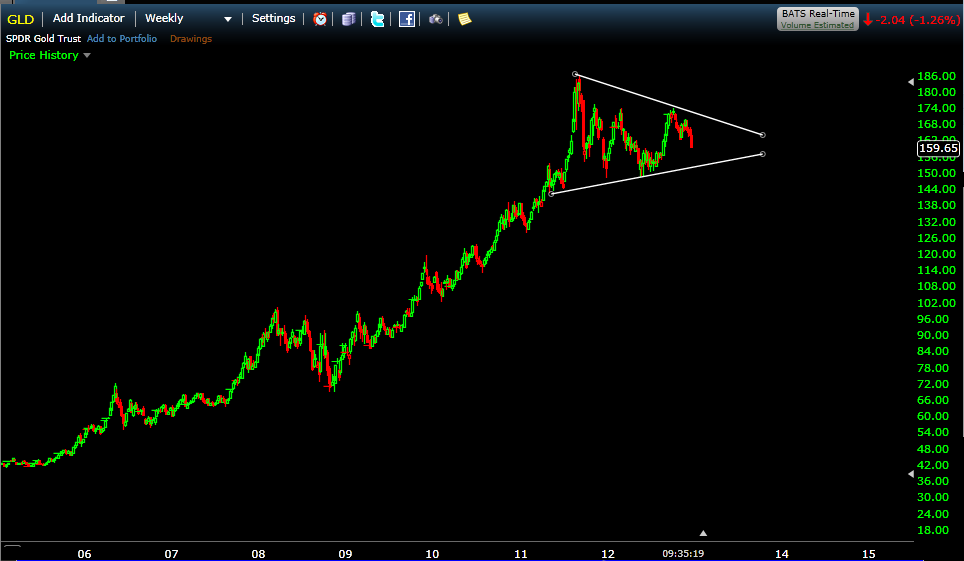
I have been watching this huge consolidation in $GLD since December. Here’s the chart posted then:
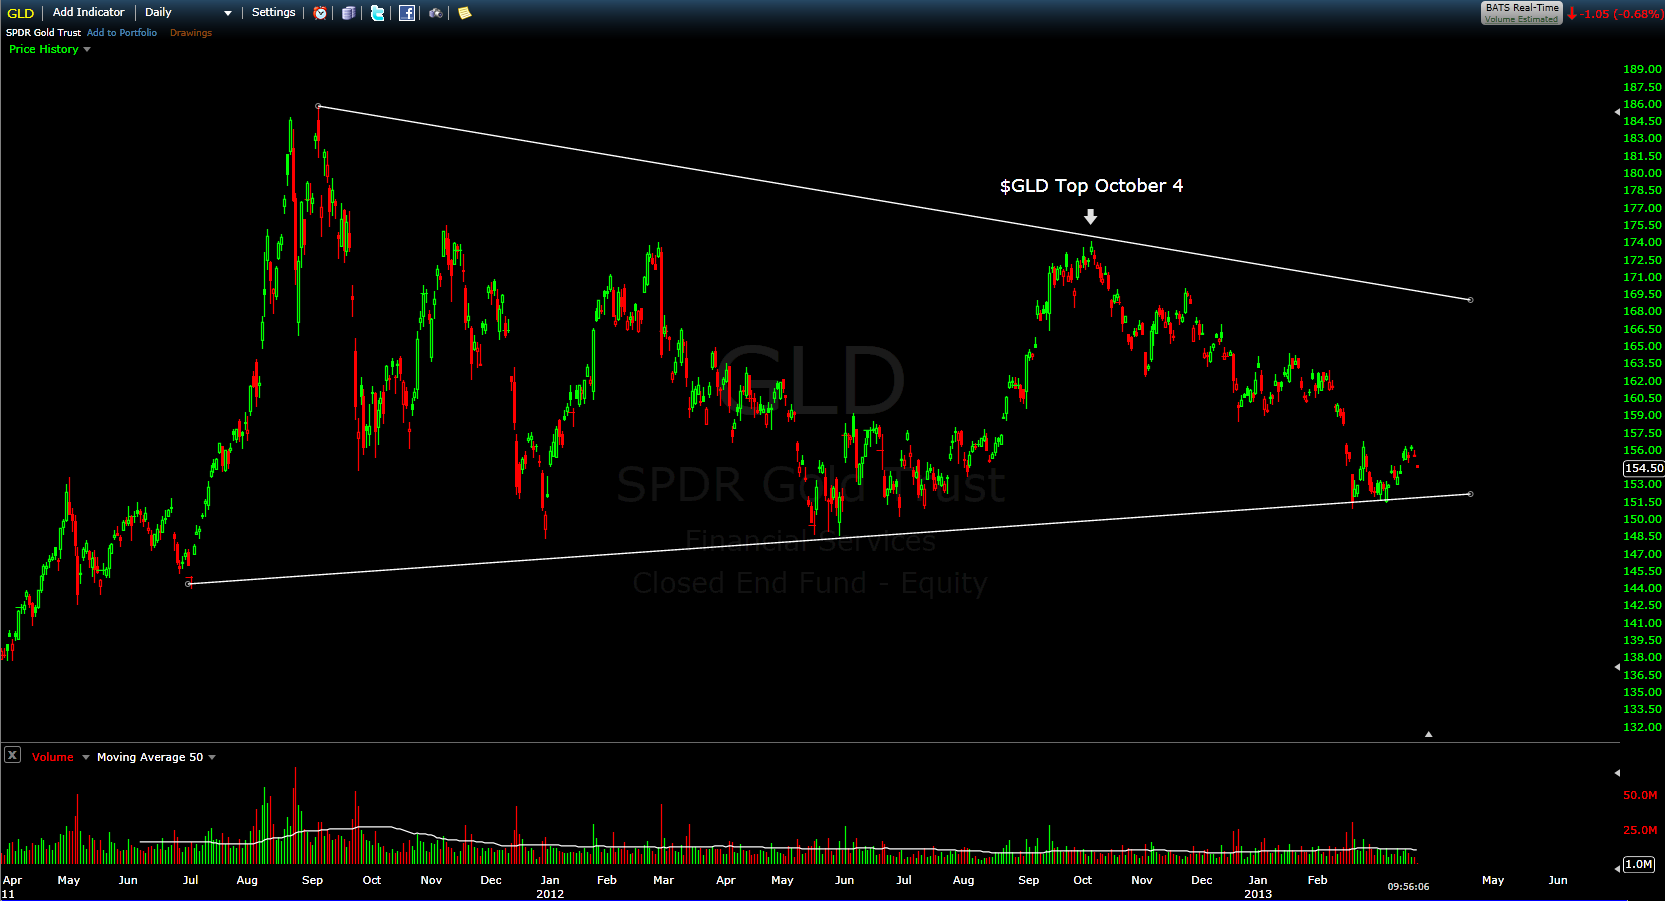
And here’s an updated $GLD chart from this morning zooming in on the narrowing range:

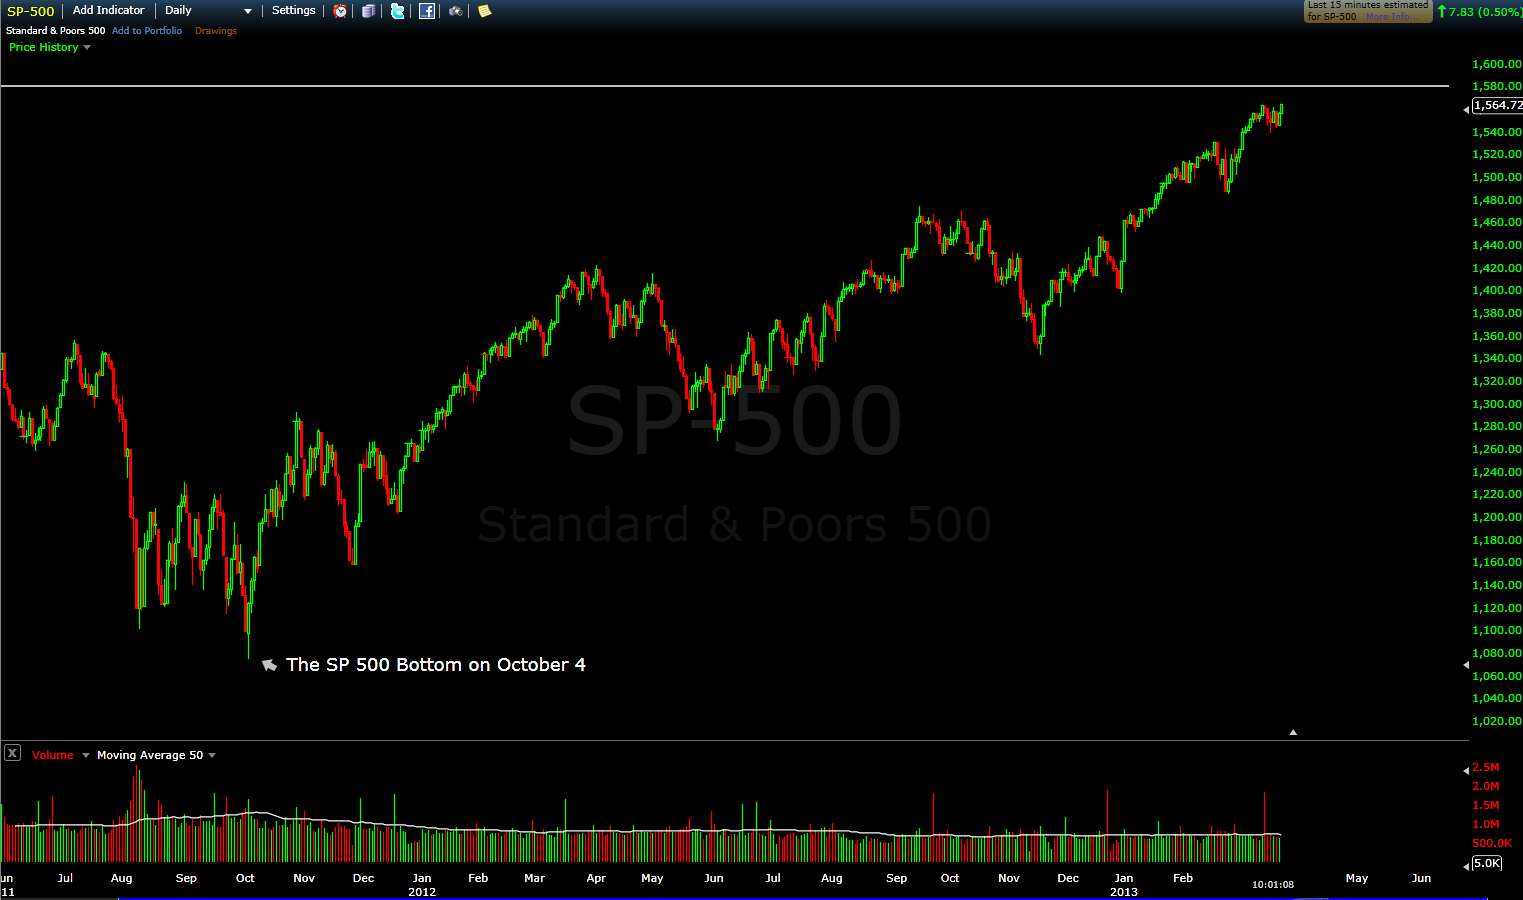
$GLD topped on October 4th which just happens to be the same day that the $SPX bottomed.

Aside from the convenient symmetry there, I take note of this as we near the bottom trend line in $GLD. A break below that level, signaling a breakdown, may indicate bullish for equities.

Leave a Reply