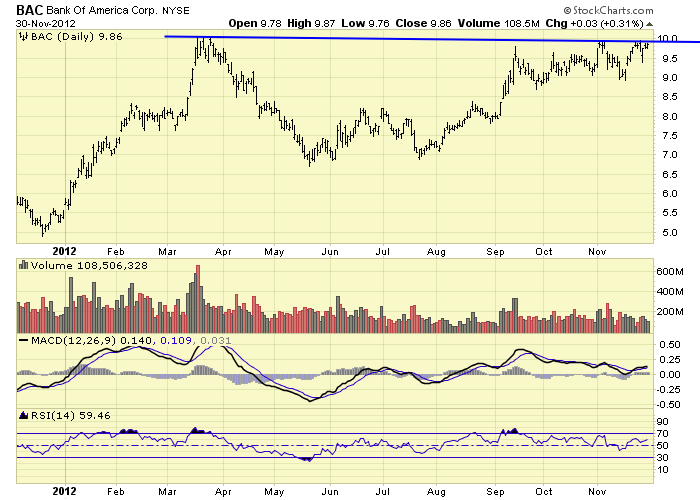
This 10 area on $BAC is one of the most watched levels in the market now.
This makes sense as it is a big level for the name having flirted with it in March and then edged close to it 3 or 4 times over the past few months.
$BAC also has larger market implications as a move taking out the 10 level would be bullish for financials ($XLF) which is a key sector when gauging the health of the broader market.
Contrarians espousing the watched pot never boils theory might note that because so many are focused on $BAC, it will not do the obvious thing but I think that view risks becoming conventional and therefore contrary to the contrary indicator.
The thing to do here in my opinion is follow price. If $BAC breaks higher on volume and follows through it will have bullish market implications and if it fails will be a negative data point. A close above 9.94 would be a 16 month closing high and an intraday move above 10.10 would be a 16 month high print.
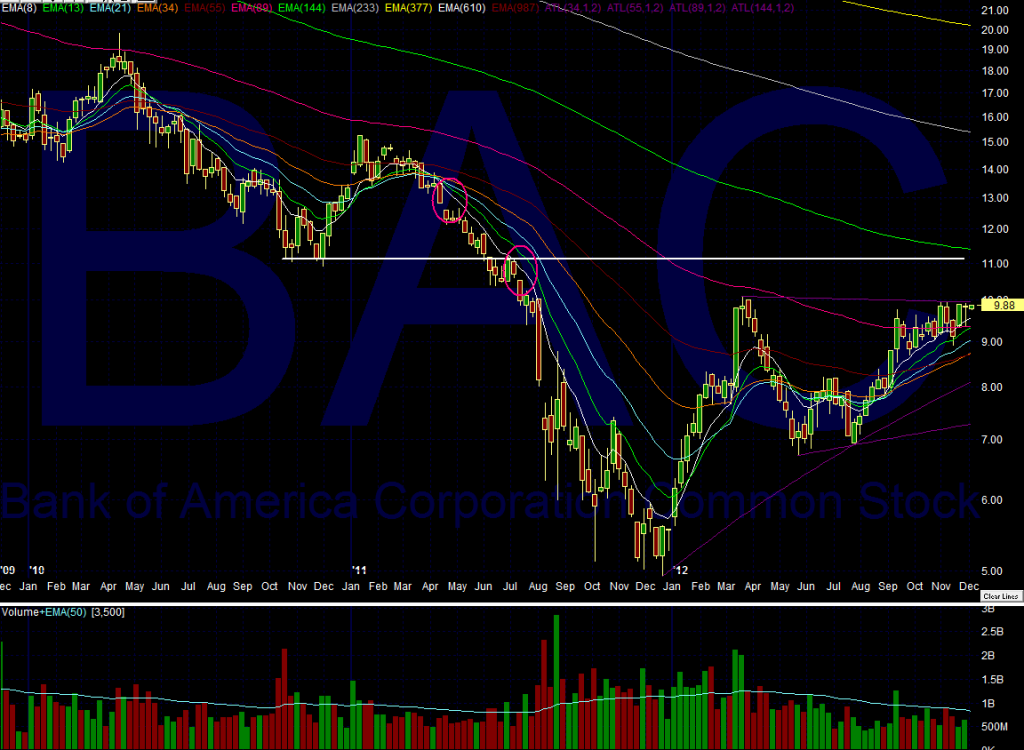
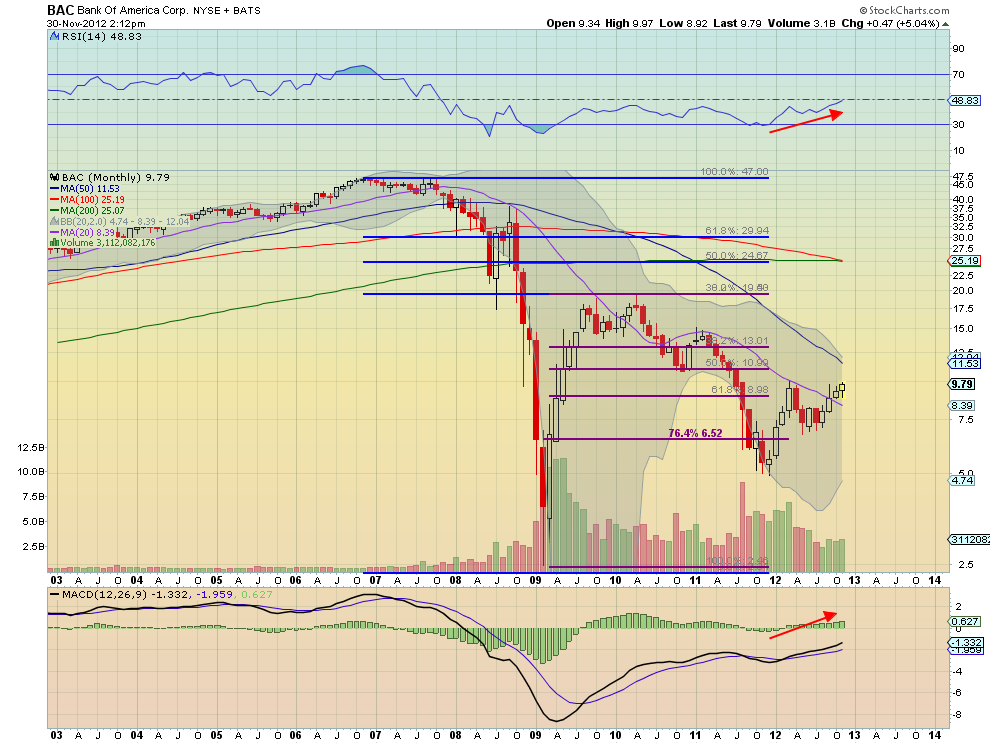
In the meantime, here a few of the cleanest charts posted to StockTwits which capture past behavior of the stock across multiple time frames:
First, Keith Kern with a 1yr daily shows us the level everyone is watching.
Next, Augur provides a 3yr weekly view including potential resistance levels near 11:
Last, Greg Harmon posted this 10yr monthly chart which provides Fib levels from the pre financial crisis top to the near end of the world bottom. 11ish also key here…


Leave a Reply