This morning I am taking a look at the acceleration in the time it takes disruption to occur.
My premise is that from the time a successful product comes to market to the time it is disrupted is quickening at a staggering pace.
Let’s start with the New York Times ($NYT). This news media company is an institution that has been a recognized paper of record since the 19th century.
The IR section of their website has stock quotes going back to January 2, 1970 where it was trading below $1 split adjusted and traded 15.6k shares on the day.
It wasn’t until 2004 that we see the brutal effects of the media disruption by the internet on the company as the price begins falling from above 50 to 7 and change where it stands today.
More recently, though, companies with great success are getting disrupted much more rapidly and a couple striking examples have been in the news very recently.
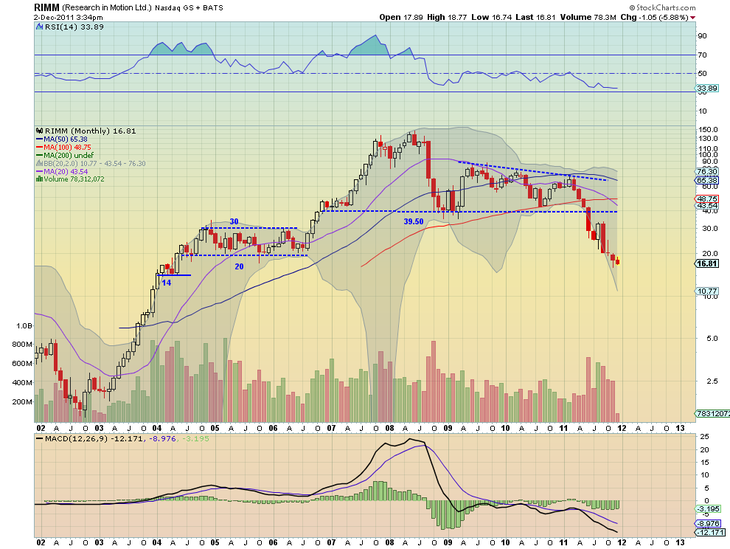
$RIMM ($RIM.CA) was initially financed in 1995 and came public in 1998. In 10 years it grew to a market cap of over 70B$ US in 2008. Today, 3 years later, it has a market cap below 9B$ US.
Here’s @harmongreg’s recent depiction of the monthly $RIMM chart on a logarithmic scale:
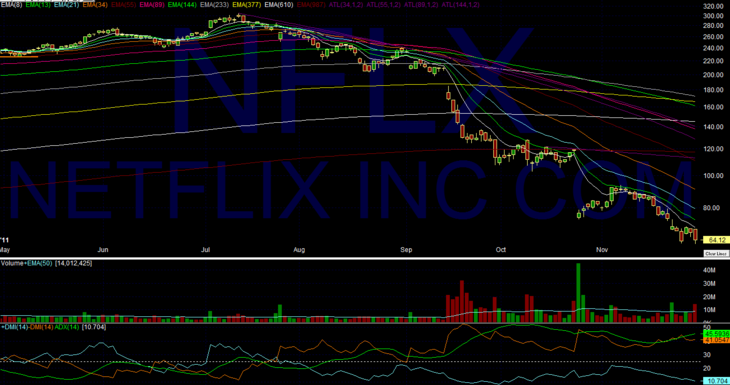
$NFLX has experienced an even quicker rise and fall. It went public all of 9 years ago in May of 2002. It peaked earlier this year with a market cap above 17B$ US but has collapsed over the past 5 months to 3.5B$ US as of yesterday’s close.
Here’s @TraderDigs’ 7 month daily Chartly chart titled, almost too kindly, Relative Weakness:
Technology is accelerating the disruption cycle and where this trend hits a wall no one can say.
The takeaway is that companies must focus squarely on innovating product regardless of the success of any one offering whose half life will shrink by the day.
The moment you stop innovating at full speed your are dead.


Leave a Reply