I just spent a couple hours reviewing the weekend Chartly Stream. There is so much good analysis and so many good trade ideas, it is ridiculous.
If you are interested in finding setups, sector analysis, technicals and learning – run don’t walk on over and spend some quality time there with a pad and pencil. You will be prepped for the Monday open.
Here’s just a smattering of charts I found of value. Click the chart for the post and a larger version…
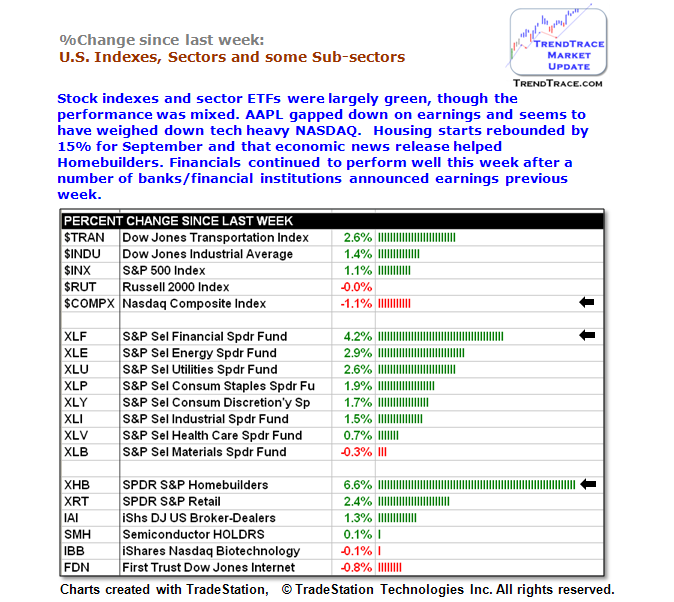
@TrendTrace has quickly become a must follow on Chartly and provides relative performance anlysis and much more generously. In this quick sector and sub-sector break down he’s got financials and builders leading this most recent charge. Who’d a thunk it:
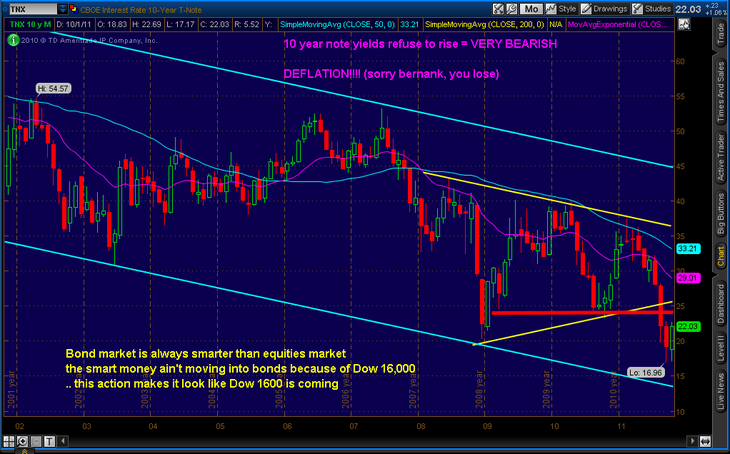
@WallStreetPro1 depicts the 10 Year Treasury and sees deflation:
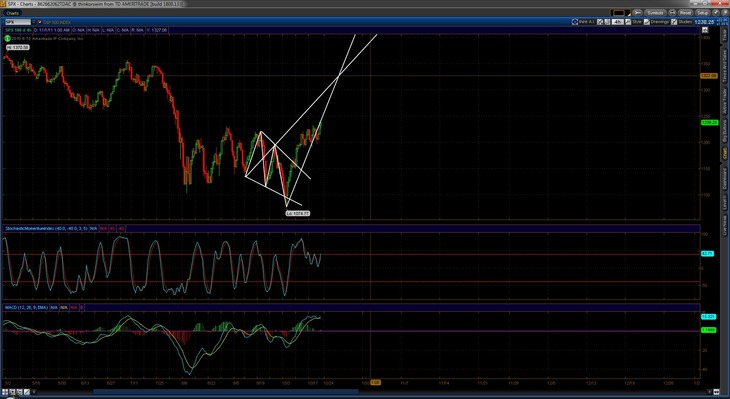
@FractalTrades does amazing work on Chartly 7 days a week. On this one, he outlines a possible melt up scenario on The SP500… “Never say never”:
On to a couple metals charts that were in play last week…
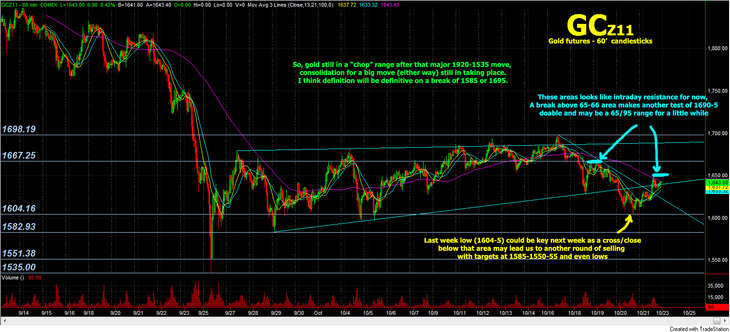
@TheEnergyTrader does fine work on the metals and this 60 minute gold futures chart gives you key levels for the coming week. I’m incorporating it into my own work on $GLD for sure:
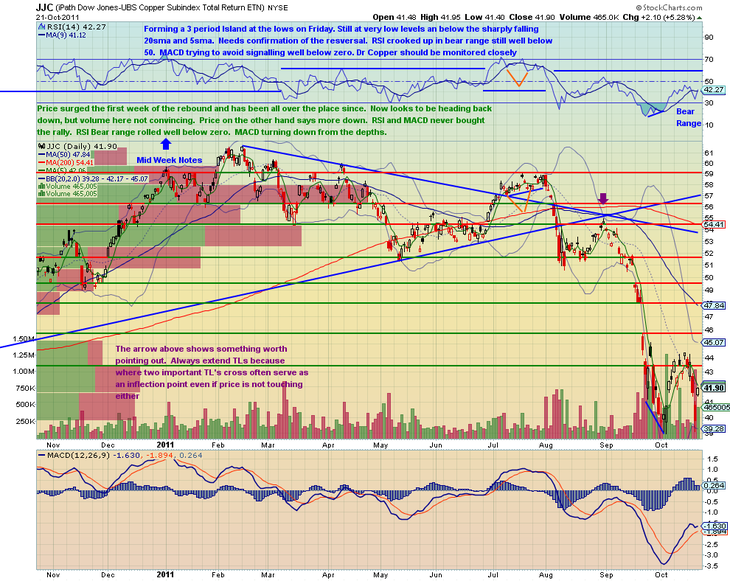
Sharp pro @gtlackey has been observing weakness in Copper ($JJC) and provides some astute chart analysis on the recent weakness and prospects for next week on the daily here:
And now for a few notable setups in individual stocks…
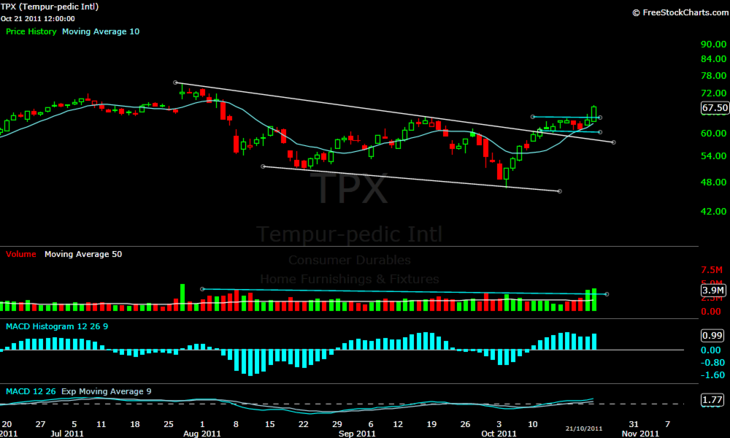
Tempur Pedic ($TPX) and Select Comfort ($SCSS) have both been super strong and reported big earnings numbers this past week. @Nashill_22 captures the play on $TPX with a few simple lines and a sharp eye:
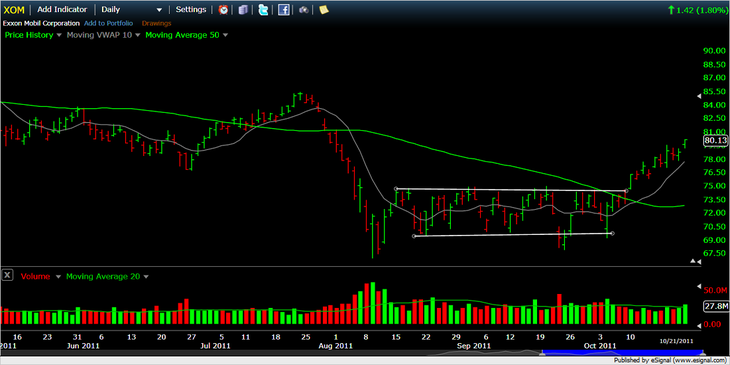
Exxon ($XOM) broke from the channel two weeks back and @TraderFlorida nicely chalks the continuation:
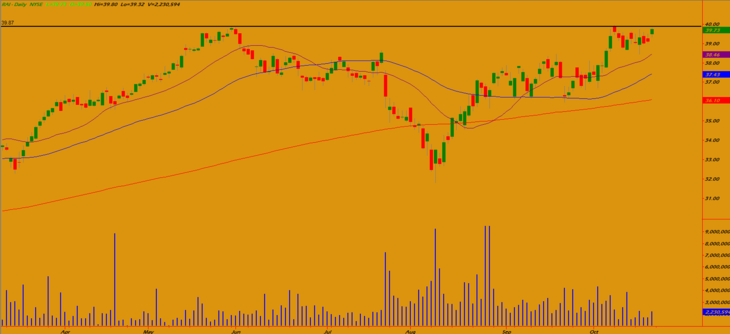
I continue to like $RAI and have posted the chart before in Chartly Review. Here, @Campagnatrading captures the setup in Halloween colors (also see @harmongreg’s work on the same name here):
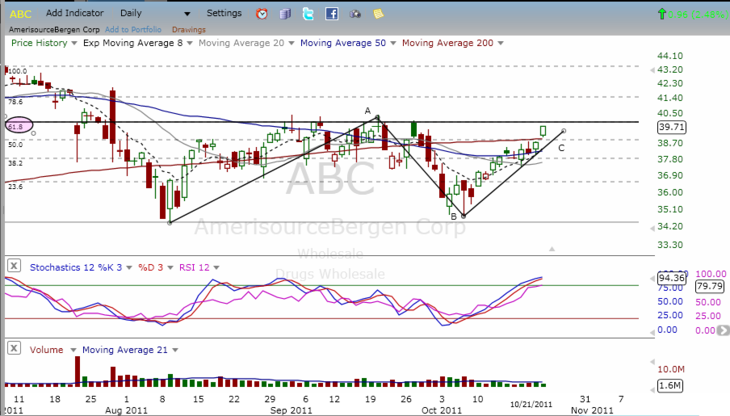
The @Fibline loves these W patterns and seems to take money out of them when the opportunity arises consistently. He’s stalking $ABC here:
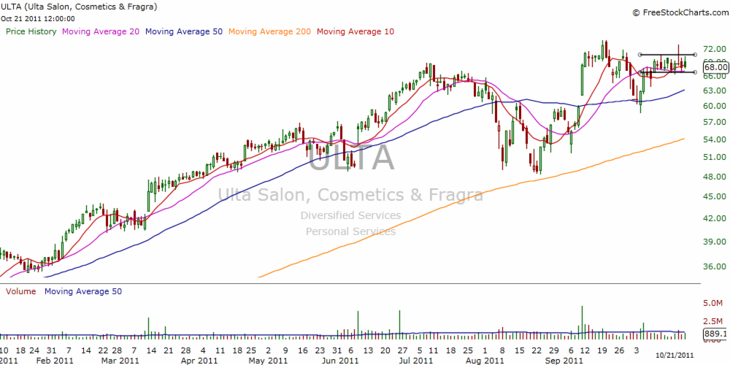
And finally, here’s one StockTwits was all over this past week and looks great tightening up here. @CommAveTrader observes $ULTA clean and simple:
$ULTA $GLD $SPY $TPX $XOM $JJC $XHB $XOM $XLF $TNX $ABC
Leave a Reply