Forensic psychologists have learned that the best predictor of future behavior is past behavior. Those with a criminal history are most likely to run afoul of the law again.
For technicians historic price behavior similarly provides clues to the future.
Over the past month, 100s of $GLD charts have been posted to Chartly some of which might help us better recognize patterns which have and will continue to occur.
The following is a summary of telling charts from the Chartly gold stream for review which might assist students of price behavior in recognizing similar blow off patterns as they are occurring in other assets. (This is only a smattering of the excellent charts posted and so for those who seek a more thorough post mortem, I highly recommend spending some time perusing the complete Chartly stream for $GLD.)
Footprints at the scene of the crime….
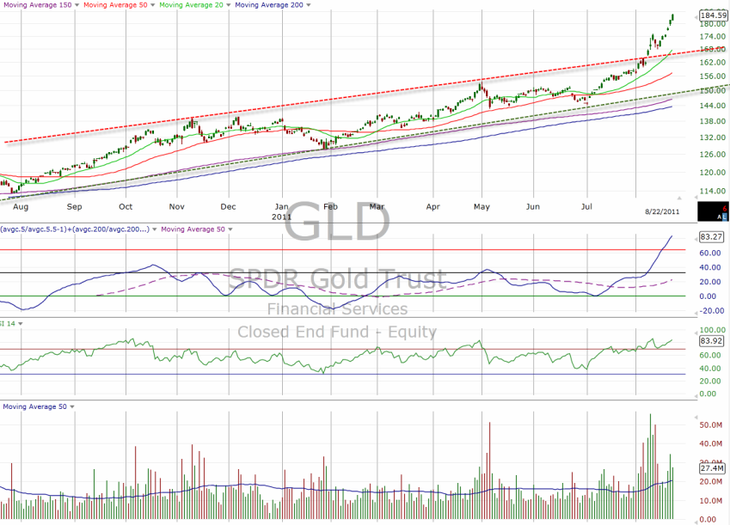
On August 22, @Global_Trader captured gold’s break above the long term bullish trend channel – evidence of historically abnormal price acceleration.
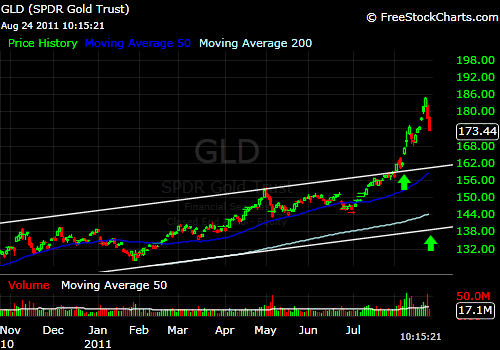
@puck2 took a snapshot only 2 days later with the same trend line but also capturing the first 2 precipitous red daily candles.
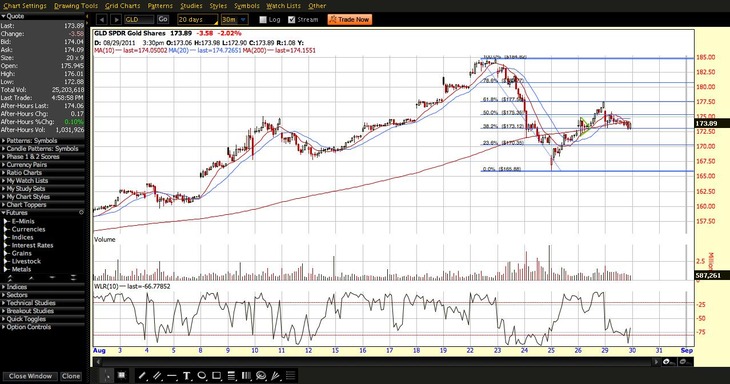
A week later (Aug 29), @stockdemons notes the failure at the 61.8% retracement drawn from the Aug 22 intraday peak to the Aug 25 intraday low.
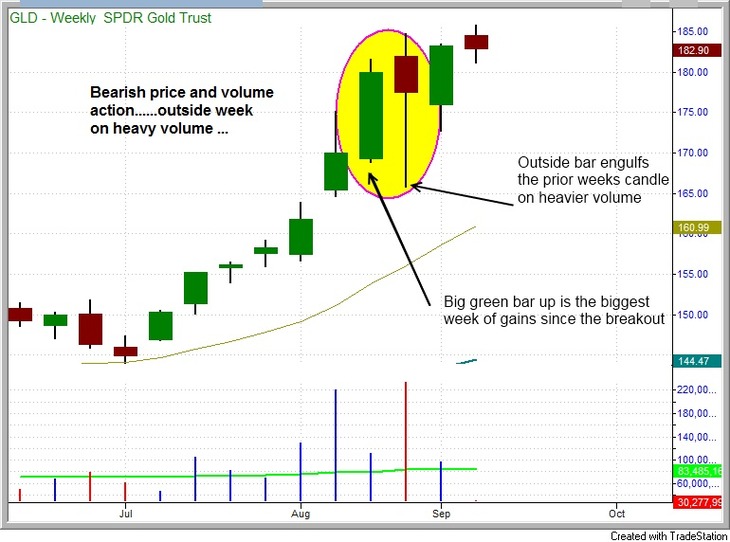
On 9/7, @MorpheusTrading observed 2 telling weekly candles denoting distribution:
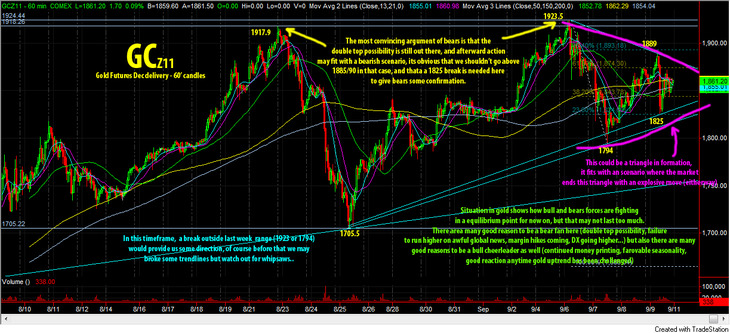
On 9/11, @TheEnergyTrader beautifully details the double top and “fight for equilibrium” on the hourly:
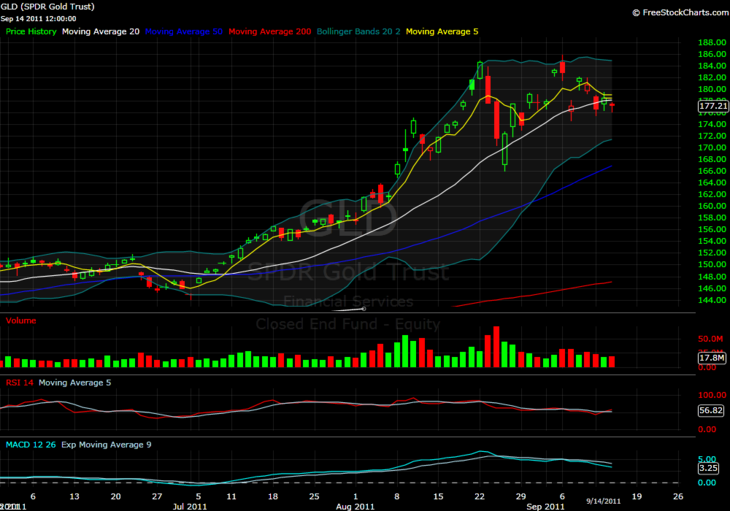
On 9/14, @alfietrade notes the first full daily candle in over 2 months below the 20 day moving average:
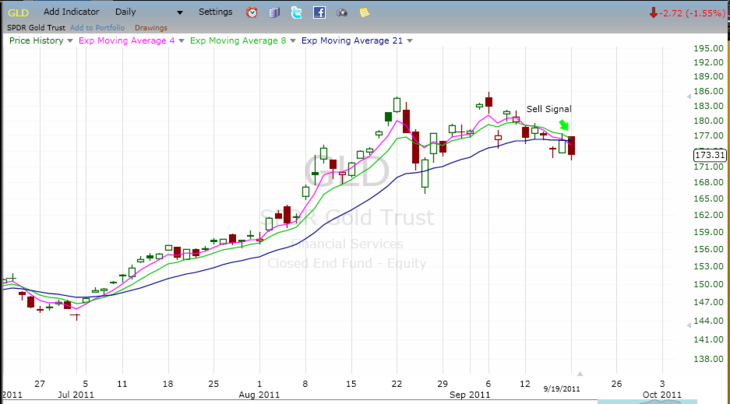
On 9/20, The @FibLine is all over the break down thank you very much:
And a bunch of good ones from yesterday…
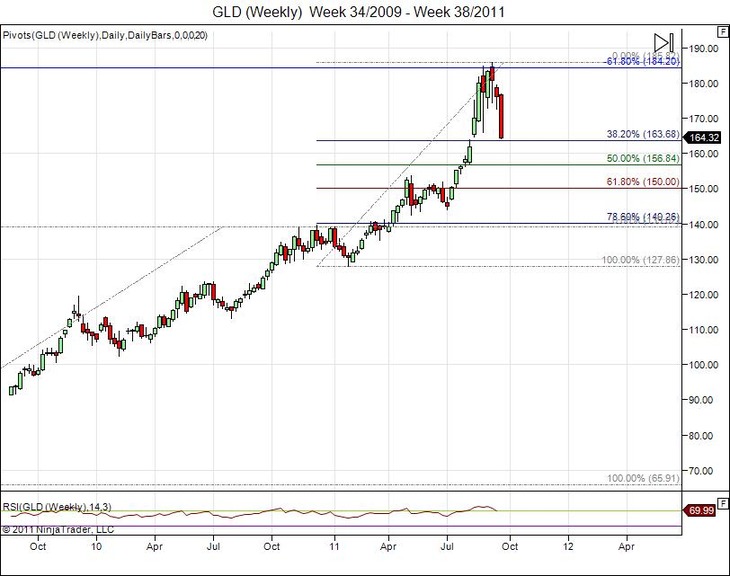
@StockTiger lays out long term fibonacci levels on the weekly:
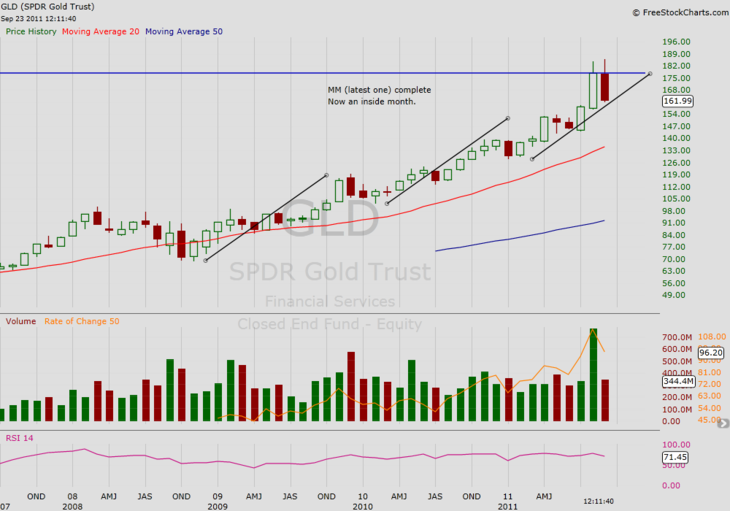
@1nvestor adds even longer time perspective on the monthly and puts the magnitude (or lack thereof) of the sell off into historical perspective:
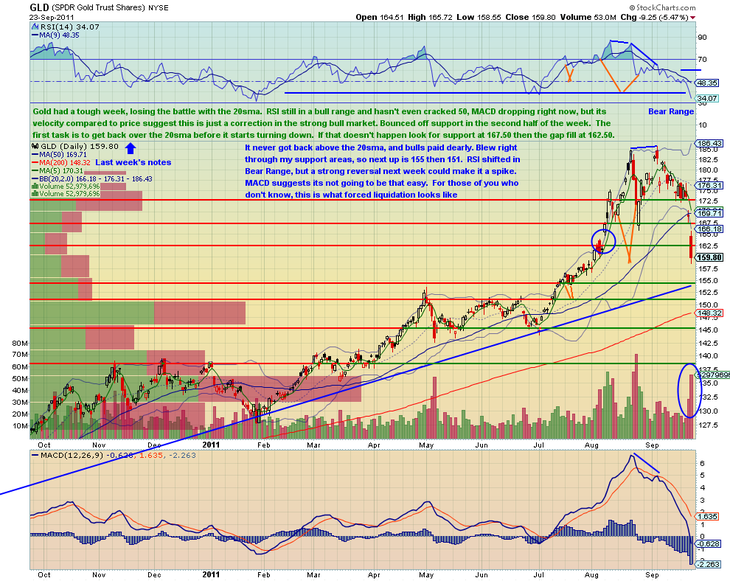
And finally, @gtlackey details the damage done:
As mentioned above, the complete Chartly stream for $GLD over the past few months is well worth closer inspection and those embedded above are only a small sampling.
In addition, past behavior is by no means a perfect predictor. Nevertheless, close inspection of a blow off and the subsequent trend break are well worth the time.
Leave a Reply