Back on October 31, I published a piece pointing to the Six Month Switching Strategy via The Stock Trader’s Almanac which highlights the bullish half of the year from November 1 to April 30.
At the time, the mood of the market was not so bullish having fallen over 100 SP500 points from the year’s highs while careening through a not so fun house of jagged troughs and fleeting peaks.
Well, here we are halfway through the best six months and the $SPX looks 5% higher. Not bad for 3 months work.
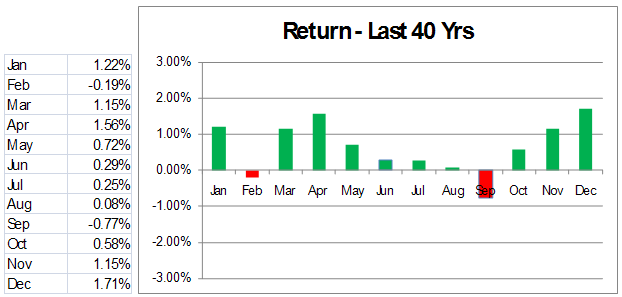
One point of immediate term caution. February is historically the worst of the best six months and the second worst month of the year.
Over the past 40 years, February has returned an average of -.19% while the average monthly return for the 12 months has been .64%. Only September has been worse with an average return of -.77%.
So if history is our guide, this month may see a rest or pull back from these recent highs.
Chart Courtesy of squirrelers.com
The Best Six Months of the Year Begins Tomorrow


Pingback: Wide World of Charts | All Star Charts()
Pingback: Morning News: February 2, 2012 | Crossing Wall Street()
Pingback: Monday Morning Look at the S&P500 | All Star Charts()